
Logging transport with Docker Swarm
Logshipper is a side-bar container that tail logs files and sends logs to external centralize logs storage.
The main reason to use it to that application doesn't need to bother with the transportation of logs. The backed app just writes logs to console (or file sometimes) and the logshipper takes care of getting it in logs storage.
The system consist of 3 main parts:
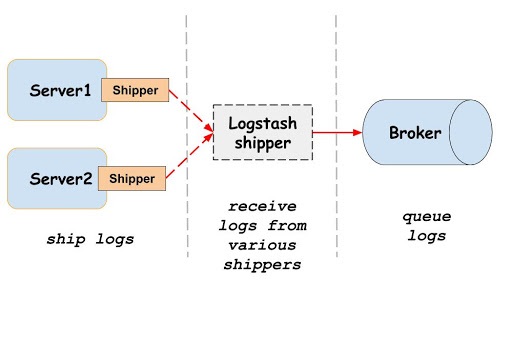
Logshipper
Logshipper is hosted on each node. It is listening to logs file or docker log driver and then handles the transportation to log buffer.
Buffer
The buffer is converting logs from transport format(Elastic beats, Syslog) and inserts data into a storage. It also can store logs while a timetime-series database is not available. Since nowadays most logs are shipped in JSON it is important that either logshipper or buffer could transform them into key-value format.
Storage
Examples: Elastic Search, InfluxDb
Log storage. In 95% cases, it is a time-series database which can store logs, events, metrics.
There are a сouple of different options for each of the 3 components. Each has pros and cons. This post will not cover it but will cover how to setup Filebeat - Logstash to work ElasticSearch and Logspout - telegraph to InfluxDb.
Here is simple config example:
Filebeat
First is necessary to create a config file for filebeat. Here is an example
| filebeat.inputs: | |
| - type: docker | |
| combine_partial: true | |
| containers: | |
| path: "/usr/share/dockerlogs/data" | |
| stream: "stdout" | |
| ids: | |
| - "*" | |
| ignore_older: 1h | |
| processors: | |
| - add_docker_metadata: | |
| host: "unix:///var/run/docker.sock" | |
| - drop_event: | |
| when: | |
| not: | |
| equals: | |
| container.labels.filebeat: "on" #filebeat will listen only to containers that has flag filebeat=on | |
| # setup filebeat to send output to logstash | |
| output.logstash: | |
| hosts: '${LS_HOSTS}' # Address will be set via Env var | |
| logging.level: error | |
| logging.to_files: false | |
| logging.to_syslog: false |
Logstash
| input { | |
| beats { | |
| port => 5044 | |
| type => "beats" | |
| client_inactivity_timeout => 3000 | |
| } | |
| } | |
| filter { | |
| mutate { | |
| ## remove dumb fields | |
| remove_field => [ "ecs.version", "[agent]", "[log]", "stream" , "[input]" ] | |
| } | |
| } | |
| output { | |
| elasticsearch { | |
| hosts => "elasticsearch:9200" | |
| index => "%{[container][labels][app_name]}-%{+YYYY.MM.dd}" | |
| } | |
| } |
The elk docker compose example
| version: '2' | |
| services: | |
| elasticsearch: | |
| image: docker.elastic.co/elasticsearch/elasticsearch:7.6.2 | |
| environment: | |
| - "ES_JAVA_OPTS=-Xms512m -Xmx512m" | |
| mem_limit: 1g | |
| volumes: | |
| - ./data/elasticsearch:/usr/share/elasticsearch/data | |
| logstash: | |
| image: docker.elastic.co/logstash/logstash:7.6.2 | |
| container_name: logstash_docker | |
| environment: | |
| - "LS_JAVA_OPTS=-Xmx256m -Xms256m" | |
| volumes: | |
| - ./logstash.conf:/usr/share/pipeline/logstash.conf:ro | |
| - logstasha: /usr/share/logstash/data | |
| mem_limit: 1g | |
| depends_on: | |
| - elasticsearch | |
| filebeat: | |
| image: docker.elastic.co/beats/filebeat:7.6.2 | |
| user: root | |
| volumes: | |
| - ./filebeat/filebeat.yml:/usr/share/filebeat/filebeat.yml:ro | |
| - /var/lib/docker/containers:/var/lib/docker/containers:ro | |
| - /var/run/docker.sock:/var/run/docker.sock:ro | |
| environment: | |
| - LS_HOSTS="logstash:5044" | |
| volumes: | |
| elasticsearch: | |
| logstash: |
That is a simple example of how ELK stack logs can be structured. For json parsing: https://www.elastic.co/guide/en/logstash/current/plugins-filters-json.html
Comments (0)